PLOT Signal Troubleshooting
This article will go over troubleshooting tips if you find that your PLot Signals are not working. There can be various reasons, but please read these steps carefully. They should resolve any PLOT Signal related issue.
- Please start with this article for general Auto Entry troubleshooting: Trade Troubleshoot
- 99% of the time, it is something very simple that will get everything working again.
- This article is for PLOT signals. If you are looking for Object Signal Troubleshooting, please see this article: https://tradesaber.com/predator-signal-troubleshooting/
The video below shows several good examples of how the PLOT Signal System works and the various ways it can be set up.
Please Continue below for more troubleshooting steps!
Step 1: Confirm Latest Version - 3.1.1.1
Make sure that you always upgrade to the latest version of the Predator before troubleshooting! Current Version: 3.1.1.1
Follow these steps to upgrade to the latest version: How To Update
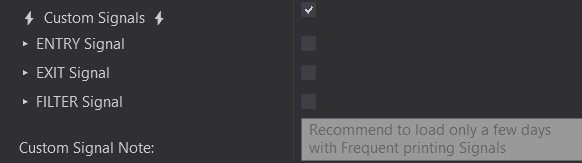
Step 2: Follow These Steps First!
It is recommended to start with these general Entry steps first to ensure the simplest steps are not missed. Please ensure these steps are followed first:
Step 3: Use Separate Windows for Charts - Do NOT Use Tabs or Minimize Windows!
It is recommended to NOT use TABS while using Signals.
Use a Separate Window for each Chart that you have the Signals Enabled on.
- This will help ensure that the Predator can read values shown from your 3rd party indicators.
- Right click on the chart and Refresh Historical Data and reload ninjascript before enabling the Predator to ensure your indicators are in a proper state to be read.
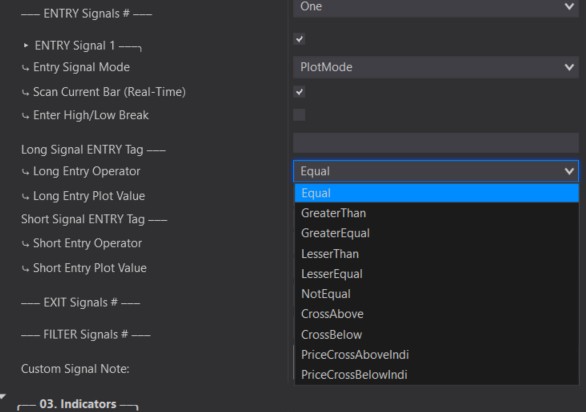
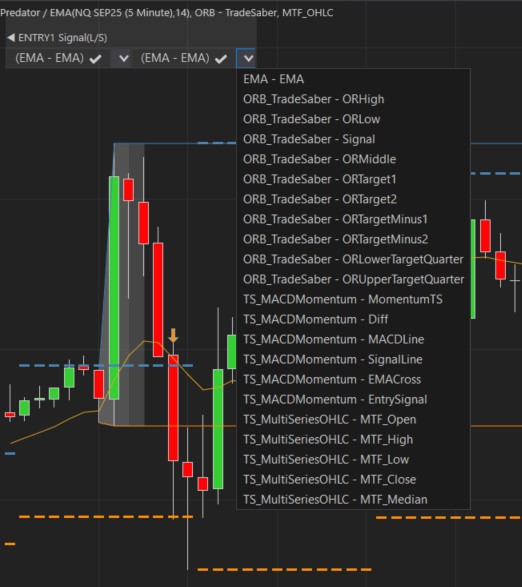
Step 4: Find The Plot Value
In order to automate plot signals, we need some sort of identifiable Plot Value.
- This can be anything from a dedicated +1/-1 signal when a Long or Short condition is present (Many TradeSaber or ninZa indicators are coded this way).
- It can also come in the form of sudden plot value change, an example being the HalfTrend indicator changing from N/A into the current price depending on the direction.
- Or it can be something simple like your indicator crossing an actual stationary value (RSI cross 50 for an example)
- It can also be the price itself crossing a plot.
Finding Plot Values:
- You can find plot values by right clicking on the chart – Show Data Box.
- Hover over a signal with a plot.
- In some cases, the plots may be transparent. You may be able to temporarily change the color inside the indicator properties to reveal the values in the data box. (Not required to show in the data box but it can help in knowing the exact values used).
Step 5: Choose Correct Operator - Choose Plot from Validation System
Operator
The operator helps us match up identifiable plot values to help us create an Entry/Filter/Exit condition based on the plot values. Some popular examples include the following:
- Equals +1/-1 when a specific signal is present, the plot value changes to a specific value (Most TradeSaber and ninZa indicators are coded this way).
- CrossAbove 0 when a signal does not have a value prior to the signal (says 0 or N/A in the data box), but gives us a value at the time the signal appears.
- PriceCrossAbove/BelowIndi is used to create a conditon when the price crosses your plot on the chart (MA’s are common to use with this).
It is not limited to the above examples. Every indicator is coded differently. You may need to get creative depending on the indicator used. If you need help with a specific indicator plot, please send us as much info as possible (See Final Step).
Validation System
- All valid plots will appear in the Validation System on the top left hand corner of your chart. Please note that you need a price change in the market to make them appear (or click on the Plots button on the top tool bar).
- Please ensure that you select the correct plot! It should match the plot from your Data Box.
- If you need to ADD or Remove or modify an indicator. Please disable the Predator X first! Re enable after your modifications have been completed.
- You should see a check mark next to name in the validation system. This confirms that it is working properly. But please note, having Tick Replay turned on will cause it to not validate while turning on. It is recommended to reselct your plot once enabled (or remove tick replay if not necessary for your indicators)
Step 6: Scan current Bar (Real time) - Most common cause of issues
It is recommended to test Signals with Market Replay. Using Historical testing may appear as if the Signals are delayed. Market Replay will give the most accurate results to how it will actually perform in real time.
Scan Current Bar (Real time) – UnCHECKED
- Most indicators will require this option remain UNCHECKED. Having this option unchecked means that it will only read the signal on a bar immediately to the left of the one that is currently forming (Picks it up immediately on bar close)
- 99% of indicators require this unchecked!
Scan Current Bar (Real time) – CHECKED
- Used for indicators that give a plot signal while on the same bar as it is still forming. Your indicator must be updating in real time for this to work. If your indicator updates On Bar Close – This will not work!
- If your indicator prints a signal only after the bar closes, then do NOT check this! Having this checked with an indicator that does not give a signal while the bar is still forming will cause missed trades!
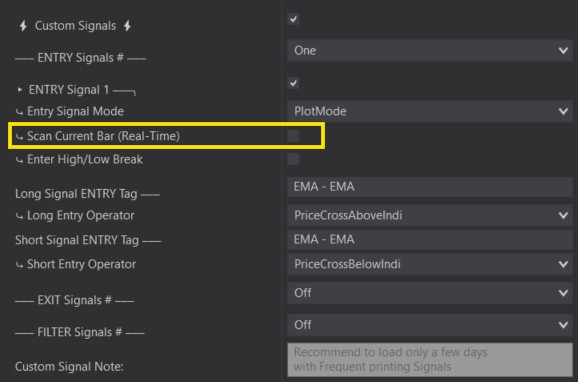
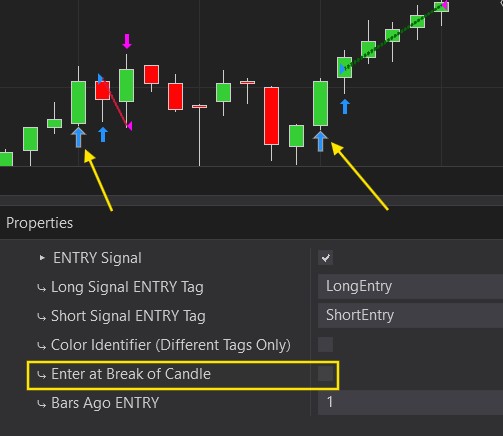
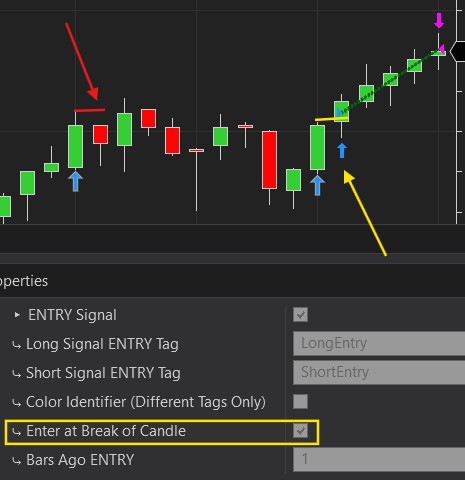
Step 7: Enter At Break Of Candle
Information below shows Object Signals. However, the same applies to Plot signal values. Having this option selected can cause trades to be missed if the condition is not met!
Having Enter At Break Of Candle selected will make it so that the price of the current bar must break above/below the previous bars High/Low once the signal is detected. If it does not, it will skip the trade.
Enter At Break UNCHECKED:
⤷ Enters when the Signal is detected.
Enter At Break CHECKED:
⤷ Enters when the Signal is detected AND the price breaks above the previous bars High (Long example).
⤷ The first signal we get here does not go above the High of the previous bar, so there was no entry.
Step 8: What If I'm Still Having Problems? - Please Send Us The Following!
If you have confirmed you have the latest version of the Predator installed and none of the above steps have resolved your issue.
Please use the Contact Us form at the bottom of this page OR send me a DM on Discord (TradeSaber(Dre)).
Please include the following information!
Not including some of these will result in a delays. I will ask for these if you do not send them in!
1. Screenshot of your ENTIRE screen.
• Include the entire Chart Trader Panel, including the version number!
(Send multiple screenshots if you cannot fit the entire chart trader in one screenshot)
• Include the top Tool Bar.
• Include the entire chart with the VALIDATION SYSTEM SHOWING!
• Point to the Signal it was supposed to take.
• Include Lower Time Stamps and any chart tabs that may be present.
2. Please send a screenshot of the Data Box Plot Values – See Step 4
• Include screenshot of the Data box itself while hovering over the signal/your intended entry point.
• Include another screenshot while hovering over a candle BEFORE the singal (This will help me see a different between values)
3. SAVE your Predator Properties XML Template and send it to me.
• How To Send Templates
• Or Take a screenshot of ALL of your Predator properties and send it to me. All the way from the Top to all the way to the Bottom.
• Even if you don’t think it’s important, please send all of the info.
