Object Signals How To video
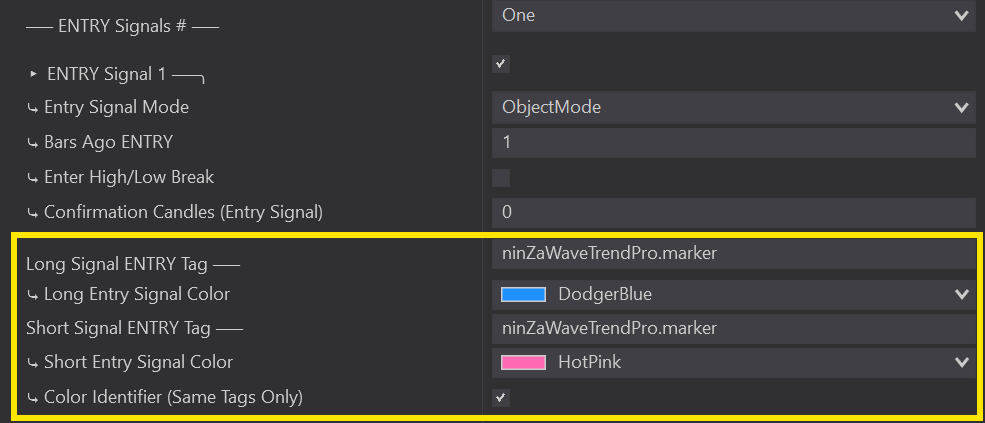
Regular Signal Entry
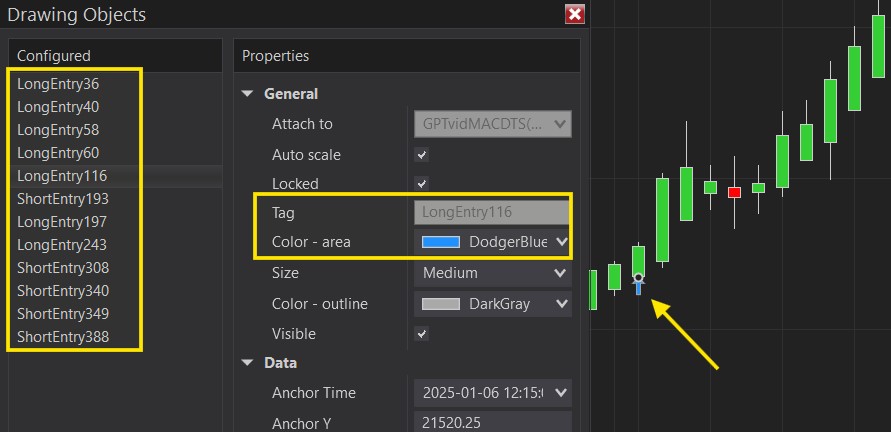
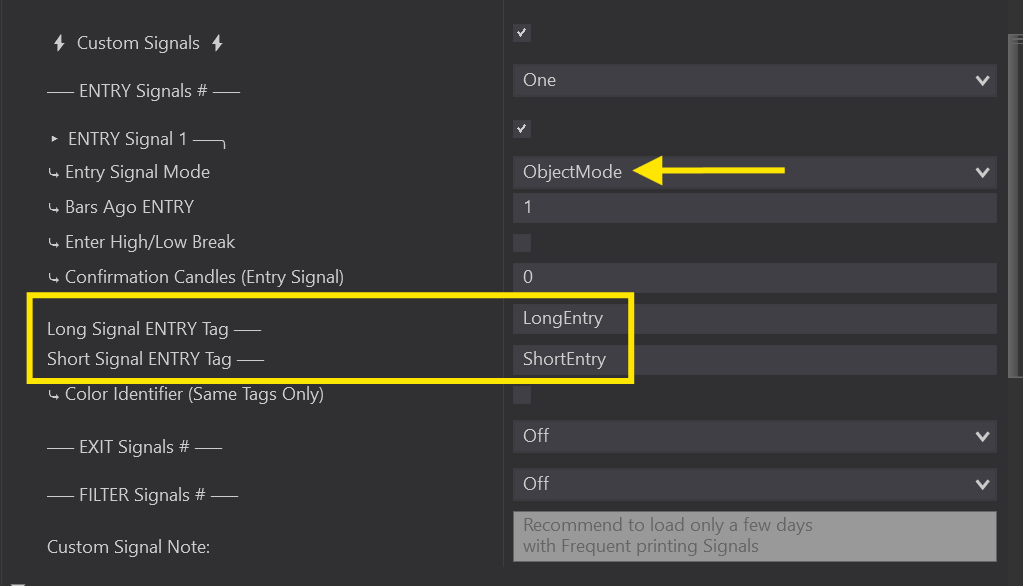
Color Identifier
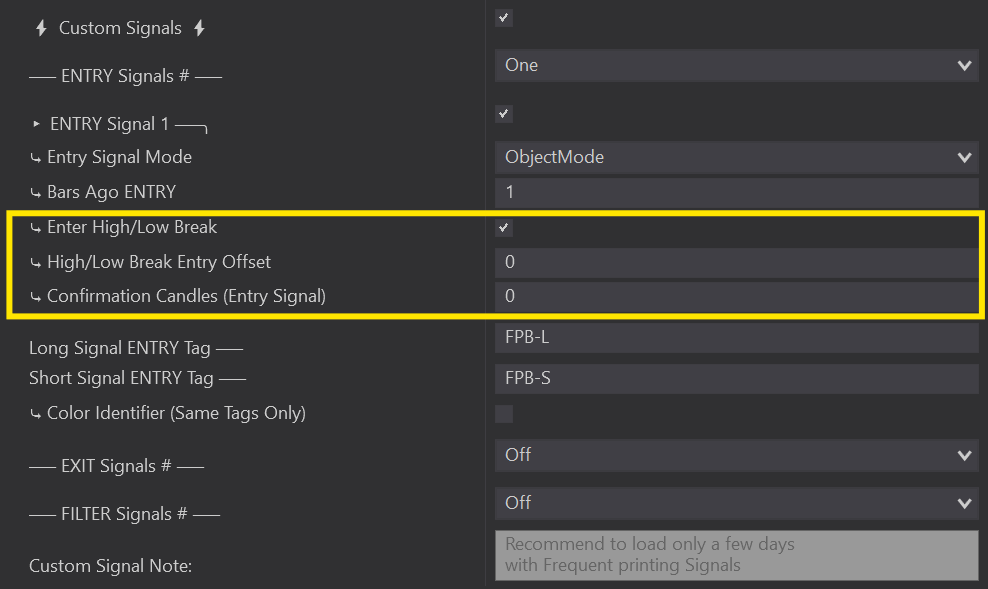
Enter At Break
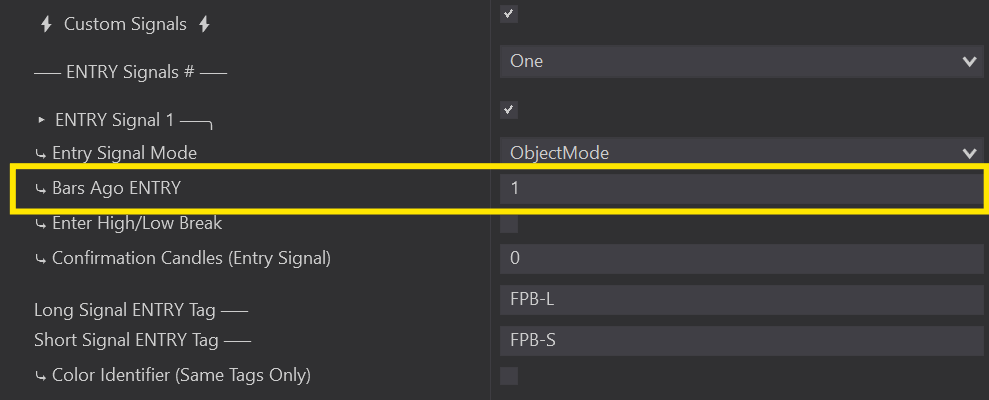
Bars Ago Entry
Plot Signals How To Video
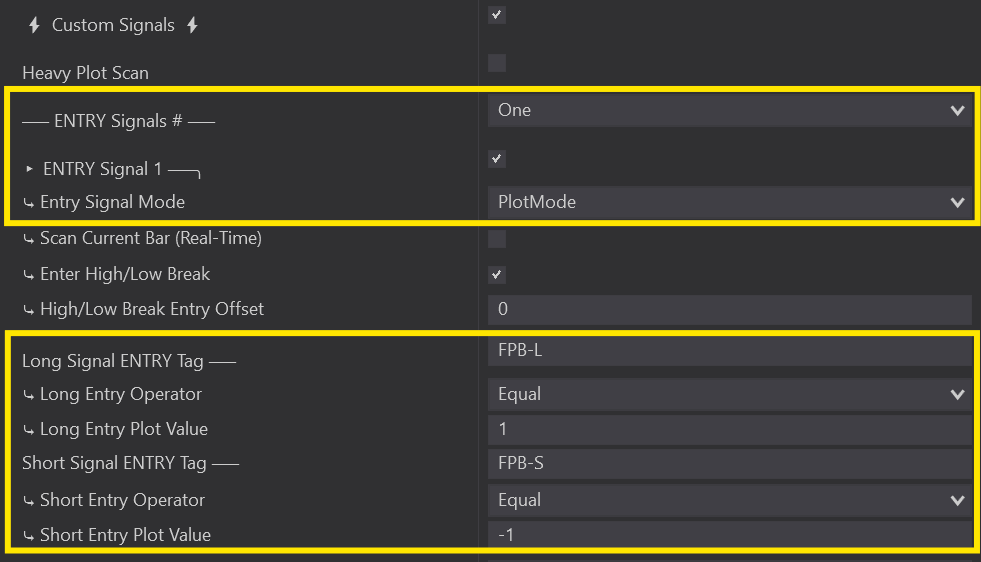
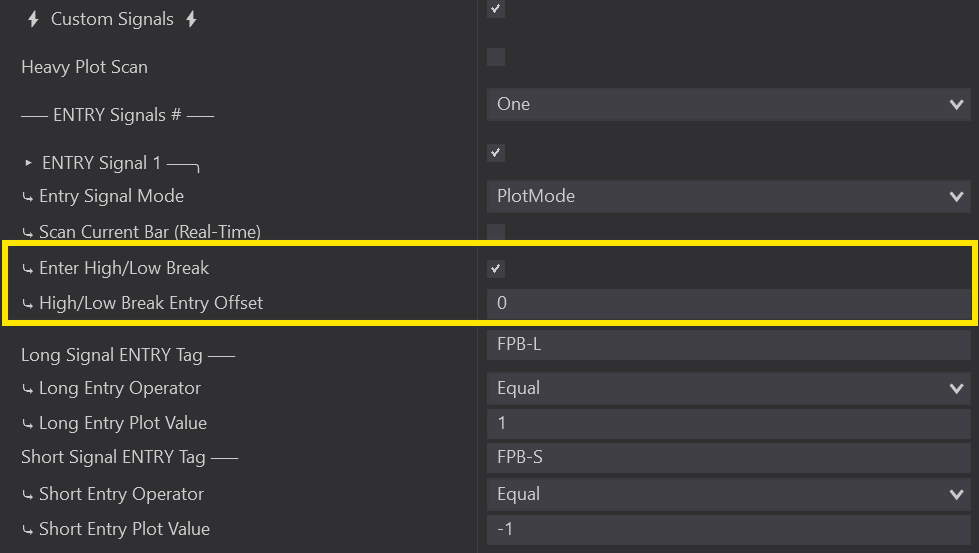
Regular Signal Entry
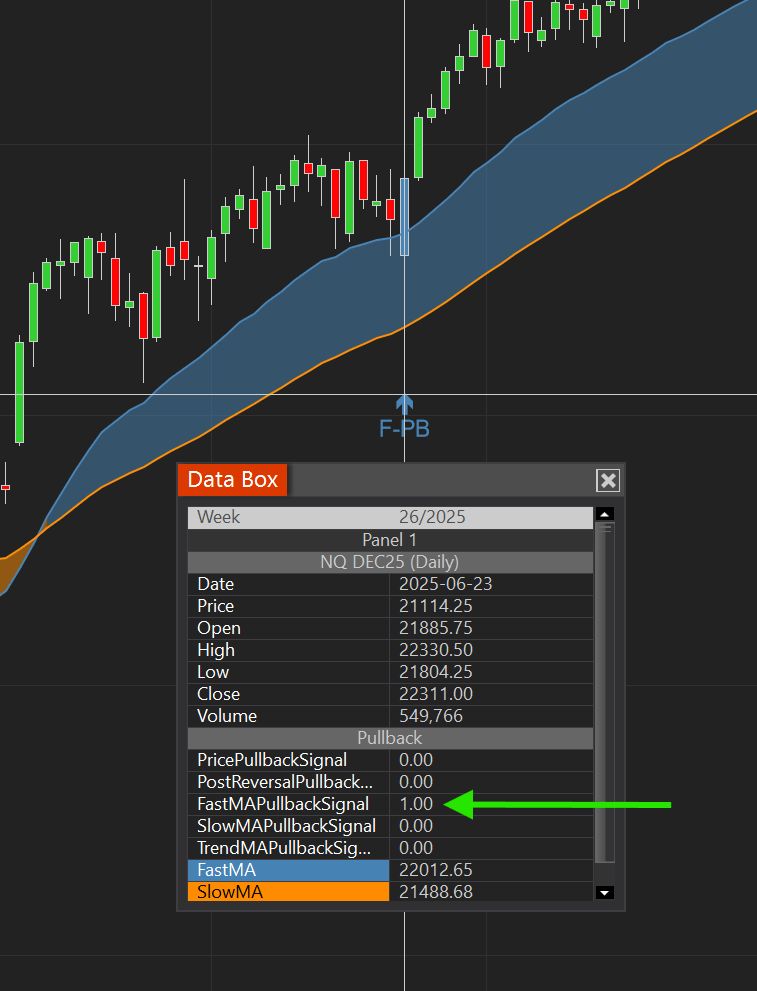
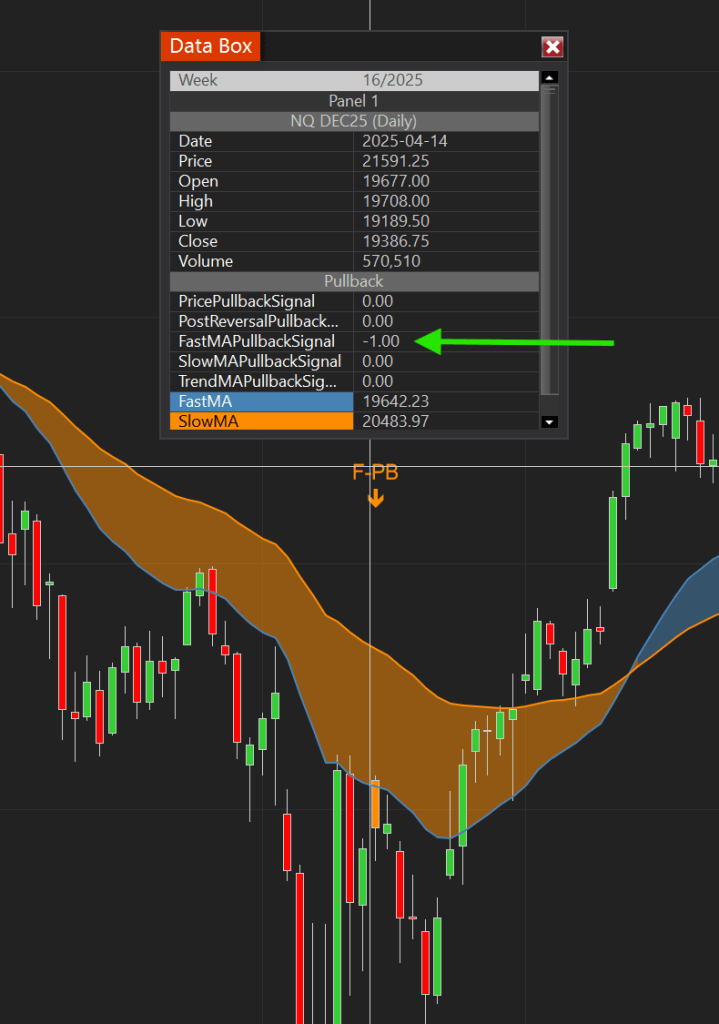
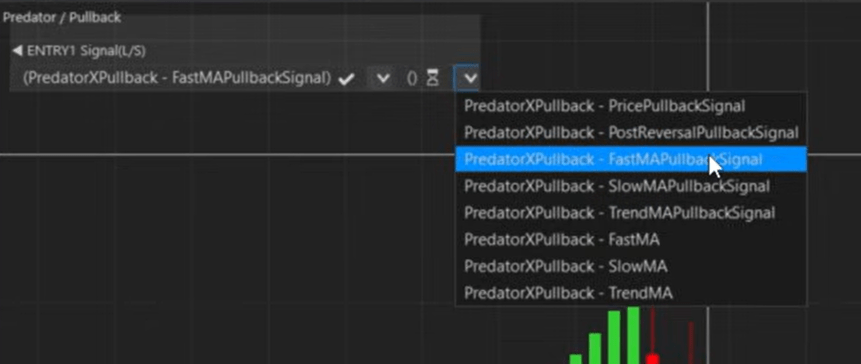
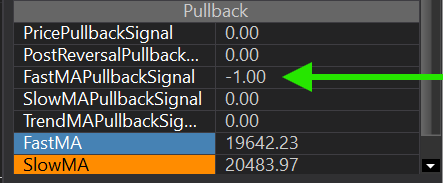
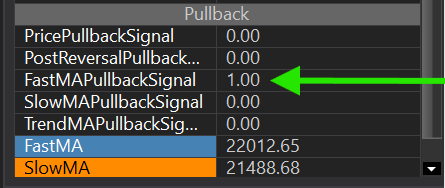
Finding Plot Values
Enter At Break
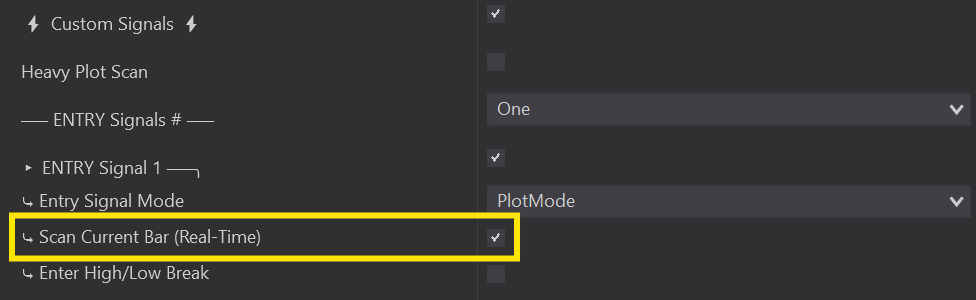
Scan Current Bar